
Science on the California School Dashboard - Coming Soon
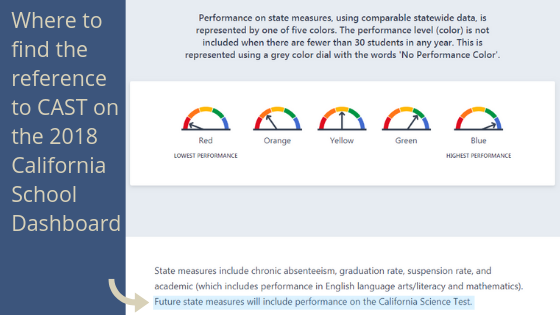
With the release of the Fall 2018 California School Dashboard, CDE has officially signaled to the field that the results of the new science assessment, known as the CAST (California Science Test) and CAA-Science (California Alternate Assessment), will be included as a state measure in the future. No timeline is given for the future inclusion of this information. However, mention of its future inclusion can and should be used as a signal and leverage point to encourage Local Education Agencies (LEAs) to invest in the implementation of NGSS. Combined with the release of the results for the 2017/18 administration of the CAST and CAA-Science, there is great opportunity to advocate at the local level for planning for and investment in NGSS implementation. This reference can be found on the Accountability page of the 2018 California School Dashboard. Scroll down to the explanation of the Dashboard dials and you will find it in the first paragraph after that information. Here is a screen shot:
Additional Accountability for Science on the California School Dashboard
Performance on statewide summative assessments (such as the CAST) is just one type of measure in our state's accountability system. Other measures, at both the state and local level, are a part of the system, and a few have connections to science and can and should be explored for information that can be used to advocate for various aspects of NGSS implementation.
State Indicators
The California School Dashboard includes assessment and some other data as indicators known as State Indicators (also referred to as State Measures on the California School Dashboard). State Indicators are
- based on data collected by the state;
- reported at both the LEA and school level;
- assigned a "color" and given a dashboard symbol to signify performance; and
- based on multiple years of data and gauge both performance and progress in order to establish a color rating.
 Screen Shot from 2018 California School Dashboard describing the color rating system for State Level Indicators.
State Indicator: College/Career Readiness
The College/Career Readiness Indicator shows how well LEAs and schools are preparing students for likely success after high school graduation. there are three levels a student may receive for this indicator: Prepared, Approaching Prepared, and Not Prepared. There are a variety of ways for students to demonstrate college/career readiness. Four of these ways have a direct connection to science in high school:
- Graduation from High School—the state minimum is two years of science, one life and one physical, in order to graduate; some districts require three.
- UC and CSU a-g requirements—both institutions require a minimum of two years of science that are Area-d approved for admission; UC recommends three.
- AP Exams
- IB Exams
One additional, potential connection is the CTE Pathway completion, depending on the CTE Pathway.
If a high school is looking to help students achieve college/career readiness, improving access to Area-d approved, AP, and IB science courses may help a school better prepare its students. Additional research into data would be required to determine how improving access to science may make a difference at the local level.
State Indicator: Graduation Rate
As mentioned above, students are required to complete at least two years of science in order to graduate from high school; in some districts, students must complete three. If a high school is struggling with its graduation rate, causes should be explored to determine if access to or performance in science courses is playing a role in low graduation rates. If so, districts should consider how to improve access, including how improving or increasing science education in middle and elementary school, will better prepare students for the rigors of high school science.
As demonstrated above, science is not absent in our current accountability system. Until the CAST is a state measure, science is certainly harder to get to than the easily identifiable English Language Arts and Math assessment state measures on the Dashboard. However, much as the state-level conversation has moved away from relying solely on assessments to measure a school's or LEA's performance, so must local stakeholders and decision-makers move to take a broader view of education and how to provide all students with a high-quality, well-rounded education, inclusive of science, that prepares them for college, career, life, and citizenship.
Local Indicators
Local Indicators are a part of the state's accountability system and are reported at the Local Education Agency (LEA) level. The standard for Local Indicators is for LEAs to measure their progress on the local indicator based on locally available information, report that information at a regularly-scheduled meeting of the local governing board, and submit the information to CDE for inclusion in the Dashboard and thereby reporting the information to the public. If these activities are done on a timely basis, and LEA is deemed to have met the standard and will receive a rating of "Standard Met." If they do not meet the criteria, they receive a designation of "Standard Not Met" or "Standard Not Met for Two or More Years" depending on the length of time they have not met the standard. It is important to note the "Standard Met" is not an indication that the information and report are favorable or indicate that an LEA is performing well in an area; it is only an indication that they gathered the information, reported it to the LEA, and then reported it to the state.
There are currently five Local Indicators reported on the Dashboard. One is the Implementation of State Standards, designed to address LCFF Priority #2 of the same name. For more information about Local Indicators and the Accountability System, visit CDE's website.
Local Indicator: Implementation of State Standards
For this Local Indicator, LEAs have the option of submitting a narrative summary of their progress in the implementation of state academic standards based on locally selected measures or tools, or using a self-reflection tool provided by the state. The public reporting on this indicator can be found on the Dashboard under the Academic Performance section of the LEA. The information in this report is a good starting point for learning about what and LEAs has done to support the implementation of NGSS (and standards more generally). If the LEA chose the narrative summary based on their own measures, a copy of the full report and information gathered may be available from your LEA.
 Screen Shot from 2018 California School Dashboard.
On the live Dashboard, click on "View More Information" to view the information submitted by the LEA.
Local Indicator: Access to a Broad Course of Study
Under LCFF, LEAs annually measure their progress in the extent to which students have access to, and are enrolled in, a broad course of study that includes the adopted courses of study specified in the California Education Code for Grades 1–6 and Grades 7–12, as applicable, including the programs and services developed and provided to unduplicated students and individuals with exceptional needs. For information on the Dashboard, LEAs provide a narrative summary of the extent to which all students have access to and are enrolled in a broad course of study by addressing, at a minimum, the following four prompts:
- Briefly identify the locally selected measures or tools that the LEA is using to track the extent to which all students have access to, and are enrolled in, a broad course of study, based on grade spans, unduplicated student groups, and individuals with exceptional needs served.
- Using the locally selected measures or tools, summarize the extent to which all students have access to, and are enrolled in, a broad course of study. The summary should identify any differences across school sites and student groups in access to, and enrollment in, a broad course of study, and may describe progress over time in the extent to which all students have access to, and are enrolled in, a broad course of study.
- Given the results of the tool or locally selected measures, identify the barriers preventing the LEA from providing access to a broad course of study for all students.
- In response to the results of the tool or locally selected measures, what revisions, decisions, or new actions will the LEA implement, or has the LEA implemented, to ensure access to a broad course of study for all students?
Look at an LEAs report on Broad Course of Study to determine how they are publicly reporting if they are teaching science in elementary. Some LEAs survey educators to determine this information. If your LEA does this type of survey, be sure to participate and provide complete information, so that public reporting can accurately reflect the status of science education in your school and district. The public reporting on this indicator can be found on the Dashboard under the Academic Engagement section for each LEA.
 Screen Shot from 2018 California School Dashboard.
On the live Dashboard, click on "View More Information" to view the information submitted by the LEA.
As demonstrated above, science is not absent in our current accountability system. Until the CAST is a state measure, science is certainly harder to get to than the easily identifiable English Language Arts and Math assessment state measures on the Dashboard. However, much as the state-level conversation has moved away from relying solely on assessments to measure a school's or LEA's performance, so must local stakeholders and decision-makers move to take a broader view of education and how to provide all students with a high-quality, well-rounded education, inclusive of science, that prepares them for college, career, life, and citizenship.